


An increasingly common theme of the energy policy debate here in Colorado, particularly among renewables advocates, is the trumpeting of cost statistics purporting to show the affordability benefits of transitioning to wind and solar over legacy fossil fuel plants.
Take, for instance, a recent statement made by Governor Jared Polis during a gubernatorial debate late last month at CSU Pueblo:
“The truth is, the highest cost form of energy on the grid right now is coal at 8-10 cents per kilowatt hour. New solar and wind energy is 2-3 cents per kilowatt hour. So, we have to ask ourselves, how much longer should we force Black Hills customers to pay more just to keep coal alive for a few more years?”
Dominique Gomez, Deputy Director of the Colorado Energy Office, made similar cost claims at a presser last week touting the benefits of the so-called Inflation Reduction Act. As reported by the Denver Gazette:
“We will continue to push policies and programs that not only reduce emissions, but also save Coloradans money,” Gomez said. “When Gov. Polis ran for office, he committed to achieving 100% renewable energy in Colorado by 2040.”
Gomez said wind projects are being built in Colorado for less than 2 cents per kilowatt hour, and new solar at around 3 cents per kWh. Gomez added this is cheaper than maintaining existing coal plants, which she said typically cost over 4 cents per kWh.
The problem with such statements is that they are half-truths, heavily reliant on what’s known as a Levelized Cost of Energy/Electricity (LCOE) metric—a useful but utterly incomplete measure of typical costs for a given generation resource.
What LCOE Is (And What It’s Not)
The LCOE of an energy-generating resource can be thought of as the average total cost of building and operating the resource per unit of total electricity it’s expected to generate over its assumed lifetime.
It is typically calculated using the following formula:
LCOE = {(overnight capital cost * capital recovery factor + fixed O&M cost )/(8760 * capacity factor)} + (fuel cost * heat rate) + variable O&M cost.
Or, as put in simpler terms in a paper from the Center for the American Experiment, “LCOE estimates are essentially like calculating the cost of your car on a per-mile basis after accounting for expenses like initial capital investment, fuel costs, and maintenance.”
LCOE values, particularly those calculated by Lazard or the U.S. Energy Information Administration (EIA), are widely used as convenient proxies for the overall cost competitiveness of various generating resources. They provide a convenient and simplistic way to communicate the basic costs of a given energy project.
However, there are some serious limitations to typical LCOE calculations that tend to result in the misuse of those statistics.
Because it’s just an estimate, LCOE oversimplifies many of the costs associated with a given resource, particularly the complexities related to financing costs and other project risks.
LCOE estimates also tend to use fixed assumptions for inputs like plant lifetimes that may or may not reflect the variation in actual plant lifespans across different generating sources.
Prominent LCOE metrics like those provided by Lazard or the EIA tend to be most often relied upon but fail to account for regional differences in resource capacity factors and fuel costs. That’s not the fault of Lazard or the EIA of course—who exist to provide national averages for such inputs—but it does highlight how ostensibly accurate LCOE values can be misleading at the state or local level.
And perhaps most importantly, LCOE measures often exclude many necessary costs associated with renewables that can make their low values misleading from their actual costs to ratepayers. Due to the intermittency of renewables like wind and solar PV, backup generation and/or battery storage is often necessary to accompany such projects. Yet those costs aren’t included in the LCOE values of wind and solar, making them seem more cost-competitive by omission.
Likewise, transmission costs generally aren’t included either, under the assumption that such costs apply equally across all resource types. But this simply isn’t true. The optimal siting for utility-scale renewables is often many miles away from where the electricity is most consumed—a distance generally much further than traditional baseload plants—requiring a far more extensive (and expensive) build out of transmission lines to connect them to the grid.
As such, attempting to use LCOE values to directly compare the “costs” of variable renewables to those of a traditional fuel-driven baseload plant winds up being more of an apples-to-oranges comparison than LCOE was originally designed to be used for.
LCOE is better used in comparing similar resources in similar contexts (i.e. a wind installation vs. a solar facility; a gas plant vs. a coal plant).
What LCOE Data Show
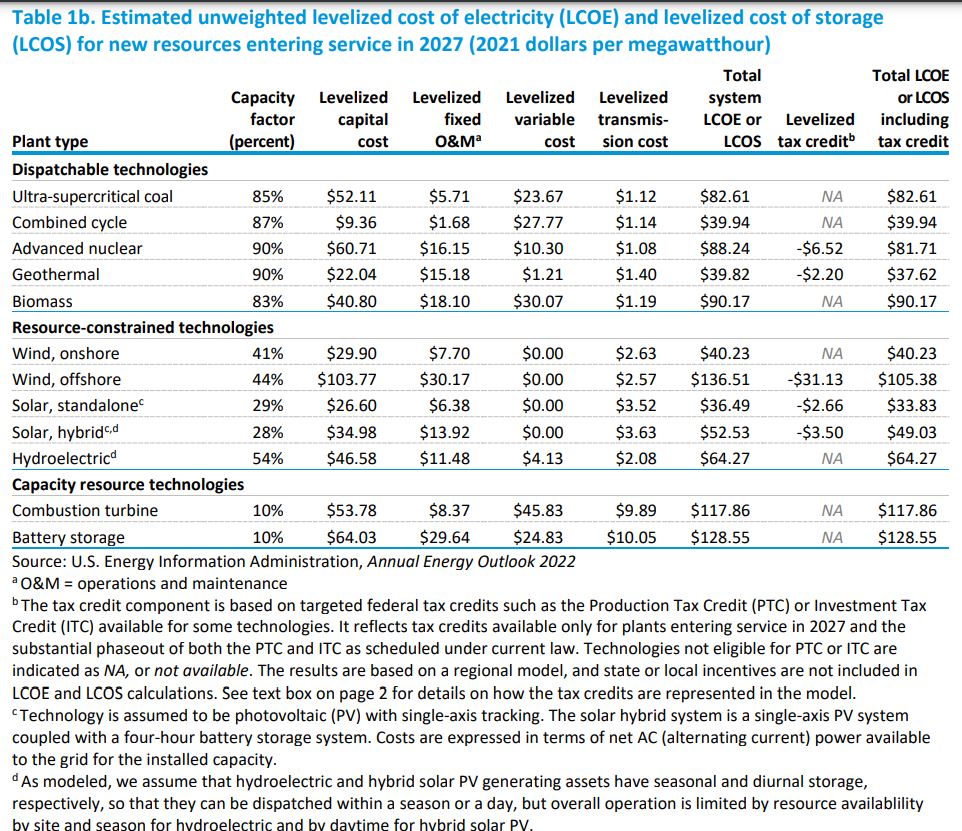
From the EIA’s Annual Energy Outlook 2022
And here is Lazard’s Levelized Cost of Energy Analysis–Version 15.0 released in October of 2021
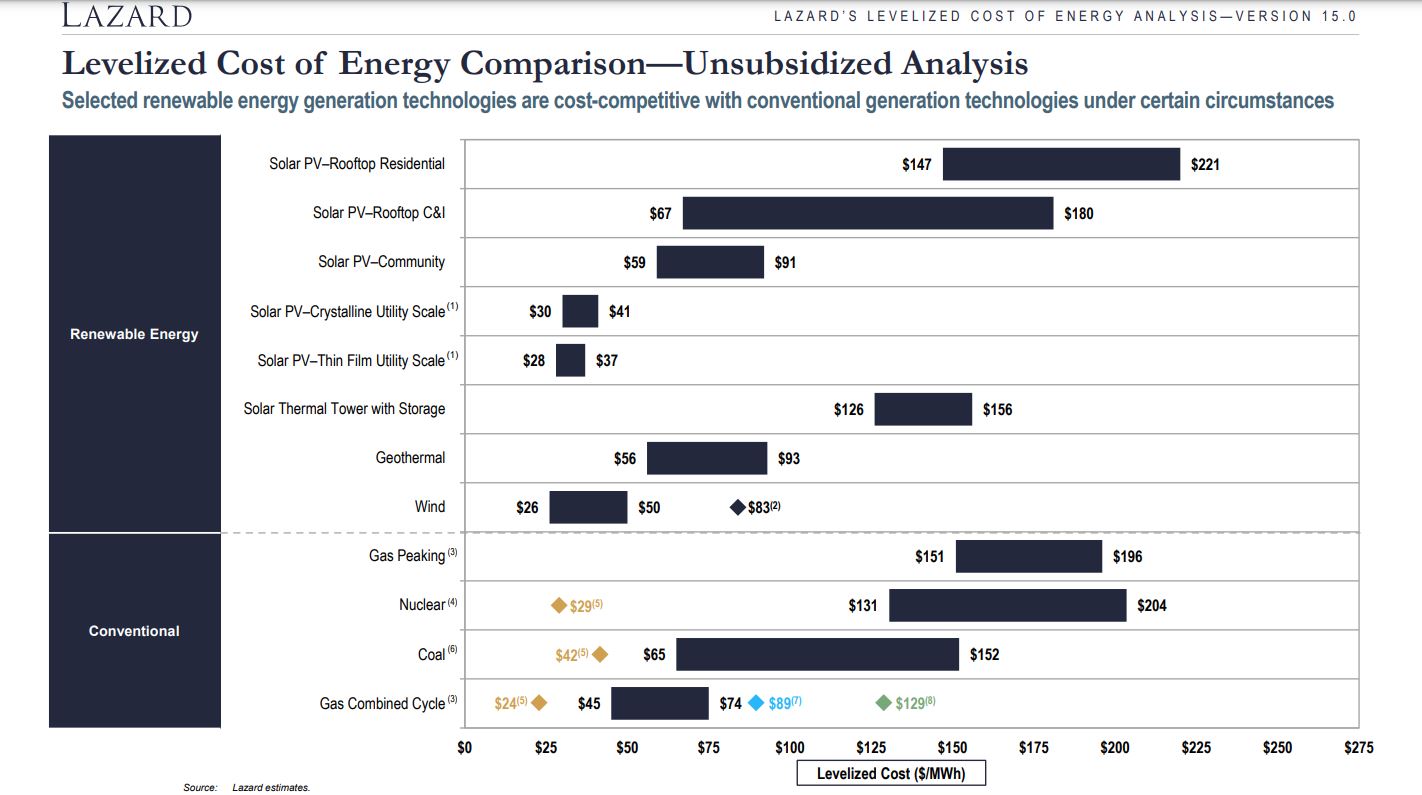
The EIA’s figures peg onshore wind at around 4 cents per kilowatt hour and standalone solar PV at about 3-5 cents per kilowatt hour. Lazard pegs utility-scale solar PV in the range of 3-4 cents per kilowatt hour, while wind clocks in at 2.6-5 cents per kilowatt hour.
Despite being national estimates, those findings are in the ballpark of the figures touted by Governor Polis and Deputy Director Gomez cited above. Likewise, recent bids from independent solar power producers submitted to Xcel Energy would also seem to lend credence to the Governor’s claims. Nearly all of the bids (note the variation in useful life and the omission of capacity factor) were submitted at an LCOE of roughly between 2-4 cents per kilowatt hour.
Now compare those figures with the following from the Center of the American Experiment’s paper “The High Cost of 100 Percent Carbon-Free Electricity by 2040,” to see why those costs, while accurate in their specific context, mislead on overall energy affordability for ratepayers.
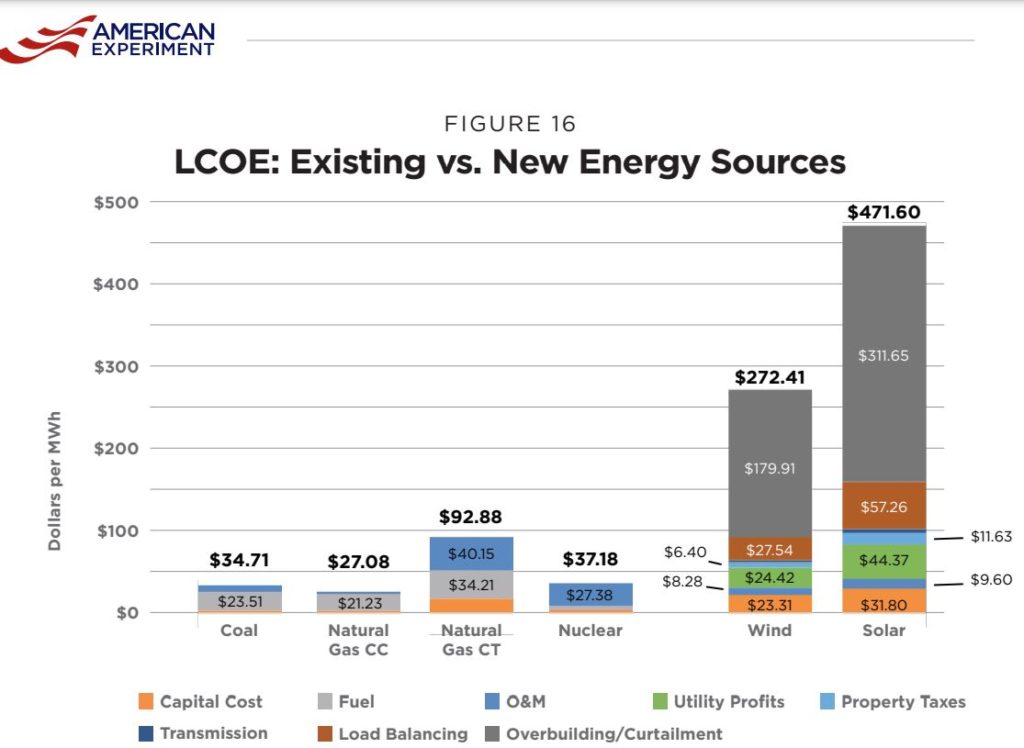
The American Experiment paper attempts to calculate useful LCOE measures of existing generation resources in Minnesota compared with new wind and solar additions. What makes it unique is that the paper’s authors included transmission, overbuilding, and load balancing costs that traditional LCOE analyses omit to provide a complete cost picture for adding enormous amounts of renewable generation to the grid.
While not directly applicable to Colorado (the paper uses Minnesota-specific data), it is a good demonstration of why attempting to compare traditional LCOE calculations for wind and solar with dispatchable baseload resources withholds a considerable amount of associated costs.
It’s one thing to say that an individual solar installation theoretically generates cheaper electricity than an existing coal plant in a vacuum, it’s quite another to say that therefore a grid-scale buildout of renewables is more affordable than continuing to generate electricity using existing infrastructure.
Beware the use and misuse of LCOE.