


IB-E-2015 (August 2015)
Author: Linda Gorman
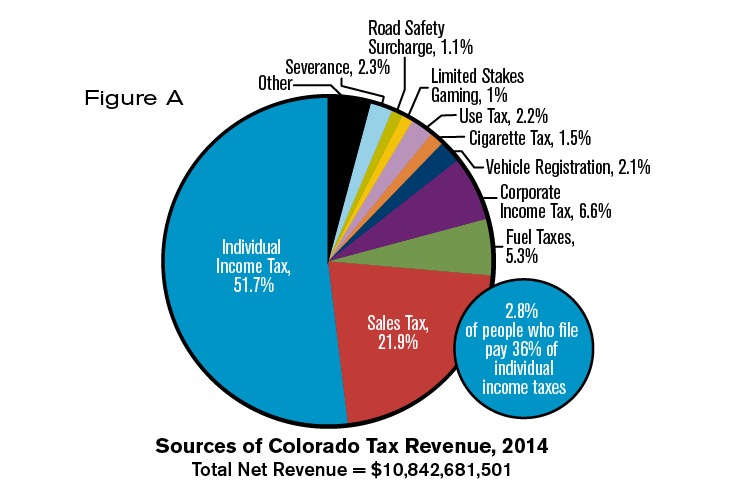
Figure A shows the different sources of tax revenue that pay for Colorado state government. Income and sales taxes generate almost three quarters of tax revenue. A small fraction of the population pays the lion’s share of the income tax. There is evidence that wealthier taxpayers are more sensitive to high rates.
State policies that discourage business formation, growth, and wealth accumulation could significantly reduce growth in wealth and income. This would reduce growth in future tax revenues. Colorado fell to 20th in the Tax Foundation State Business Tax Climate Index in 2015 after ranking 16th in 2012.
Colorado has a flat income tax of 4.63 percent of an individual’s federal tax liability. In practice, state and federal tax credits and exemptions can substantially alter the actual
rate a taxpayer pays.
In 2014, the Colorado Department of Revenue’s Annual Report listed 32 categories of tax credits worth $332.1 million, about 3 percent of Colorado tax revenues.
In the FY 1999 Annual Report there were 11 categories of tax credits worth just $196 million in 2014 dollars.
Although marijuana tax revenues are widely discussed, as of March 2015, all of the marijuana taxes, licenses, and fees collected by the state since 2013 had generated $76.2 million, about 0.7 percent of FY 2014 revenues.
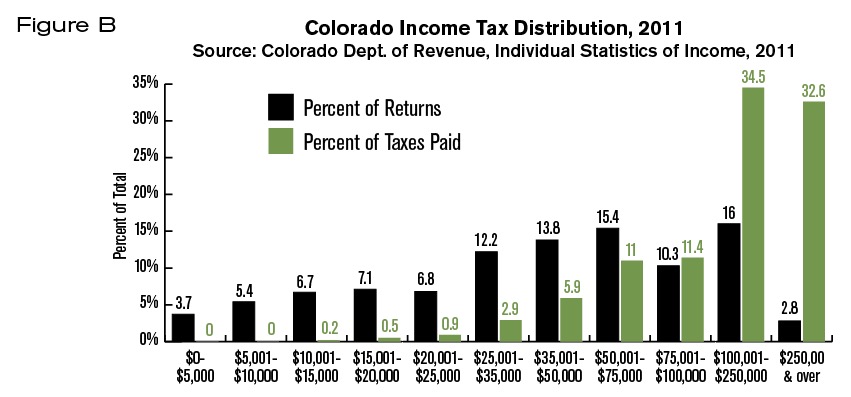
In Figure B, data from 2011, the latest year available, shows that Colorado households with incomes above $75,000 filed 29.1 percent of tax returns, and paid 78.5 percent of all income taxes. There were 56,197* households with incomes above $250,000 a year. They filed 2.8 percent of all returns, yet paid 32.6 percent of all Colorado individual income taxes.
National data suggest that wealthier taxpayers are more likely to take action to avoid high tax rates,4 and that membership in the high income group is fluid. About 30 percent of those who file returns with income in the top 1 percent are in a lower income group, sometimes much lower, in the next tax year. About 19 percent of the income for Colorado’s highest income group is generated by capital gains. A significant fraction of that income likely derives from the one-time sale of a major asset such as a home, or a business that took a lifetime to build.
The state has published misleading data about the proportion of taxes paid by low- and high-income households. The 2013 Colorado Tax Profile Study reported that
…the 14 percent of households in the highest income category continue to earn 50 percent of the adjusted income in the state. The payment pattern of state taxes among households indicated that households in the lowest income group paid a greater proportion of taxes than the proportion of statewide income they received. Households with the highest incomes paid a smaller proportion of taxes compared to the proportion of statewide income they received. [italics added]
This analysis disregards how income is defined. Low-income groups receive in-kind benefits that increase effective household income but are not included in money income. These include subsidized housing, child care, free school lunches, home energy assistance, and Medicaid. Adding the value of these benefits to household money income would reduce the proportion of taxes paid by low-income groups relative to their income.
Since 2000, inflation-adjusted Colorado state spending has risen by 38 percent. Inflation-adjusted tax revenues have risen by 8.8 percent. Upper income people already bear a disproportionate share of the state’s tax burden. Attempting to extract additional revenues from the private sector will depress future economic growth. To balance expenditure growth with tax revenue growth, state government must avoid new spending and seek to bring existing spending into balance with economic reality.
*Correction* As originally published, this Issue Brief incorrectly stated that there were 6,197 households with incomes above $250,000 a year in 2011. The correct number is 56,197 households. The percentages given were calculated with 56,197 households and are unaffected by the correction.