

How the state’s largest monopoly utilities have benefited financially in former Governor Bill Ritter’s New Energy Economy.
By Brit Naas
Executive Summary
The last ten years of Colorado energy policy can be defined as the decade of what former Democrat Governor Bill Ritter dubbed the “New Energy Economy,” (NEE) a fundamental transformation of how the state has powered its economy and provide electricity for its residents. The NEE goal was to move away from the baseload workhorse coal electricity and toward natural gas and industrial wind. During his 2006 campaign Ritter told his staff, “I want my first ad to be about turning wheat fields into wind farms.”
Analysis of financial reports from the state’s two largest utilities over the time span of the New Energy Economy shows both Xcel Energy and Black Hills Energy, Colorado’s electric monopolies, have enjoyed significant financial benefits without significant growth in their customer base.
- Encouraged to shut down coal plants and build new industrial wind and natural gas, both monopoly utilities have seen significant increases in their total assets on which they each earn a rate of return.
- Both monopoly utilities have significantly increased their profit and profit margins.
- Neither company has seen significant customer growth.
- Profits and assets per ratepayer have risen sharply.
Colorado: a ‘no choice’ state
Colorado is a regulated electricity state, meaning “vertically integrated monopoly utilities cover the entire value chain with oversight from a public regulator” – the Colorado Public Utilities Commission (PUC). “The utility makes sure that power is generated, sent to the grid, and reaches customers. Customers in regulated markets cannot choose who generates their power and are bound to the utility in that area.”
Electric service providers in the state include two “investor-owned” electric utilities, 29 municipalities, and 22 electric cooperative associations. The PUC has jurisdiction over both investor-owned – monopoly – utilities Xcel and Black Hills and one electric co-op, as well as partial regulation over the municipal utilities and electric rural co-ops.
The Colorado Public Utilities Commission consists of three commissioners appointed by the Governor and confirmed by the State Senate. No more than two commissioners may be from the same political party.
It’s up to the PUC to determine and “to achieve the appropriate balance between the needs of Colorado customers for safe and reliable utility services at reasonable rates and the needs of utility service providers to earn a reasonable profit and to sustain a reliable utility infrastructure throughout Colorado.”
Colorado’s largest electricity providers are Xcel and Black Hills, together servicing 2,922,037 ratepayers. Both monopoly utilities enjoy the exclusive right to serve defined markets and are publicly traded, for-profit corporations that provide yearly dividends to their shareholders.
Due to their size, the focus of this column is on Xcel and Black Hills.
Perfect environment for monopoly profit: the legislature, the PUC, and monopolies
In 2007, the Democrat controlled state legislature began transforming how Colorado would generate and deliver power to residents following Democrat Bill Ritter’s successful gubernatorial campaign. Ritter promised to create a “New Energy Economy.” In four years , the one-term Governor pushed through the General Assembly a legislative packet of some 57 bills including key cost drivers like fuel switching, demand-side management, and the renewable mandate with the ultimate goal of shutting down coal-fired electric generation and building new natural gas and industrial wind.
As the monopoly utilities complied with new law, the PUC authorized both utilities to recover costs from ratepayers usually through base rates or additional riders on ratepayers’ monthly bills.
Legislative meddling in electricity policy such as mandates and fuel switching provided monopoly utilities the perfect excuse to expand and increase the value of their asset base at ratepayer expense. This is crucial. Utilities already have a financial incentive to build because they earn about a 10 percent return on their asset base. Do the math. Ten percent of $2,000,000 is far more than 10 percent of $1,000,000. So, the more their asset bases’ value grows through building new capacity, the more utilities earn for their shareholders.
Ratepayers have no choice but to pay the higher prices.
Xcel Energy
Customer Base
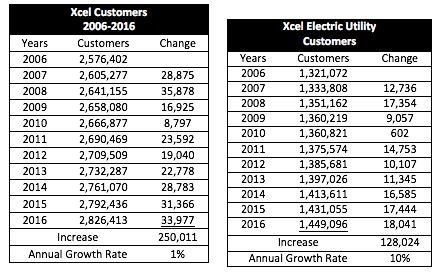
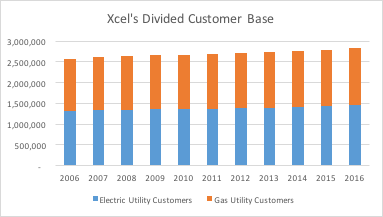
Xcel provides gas and electric service to a combined total of 2,826,413 ratepayers. Over the last 10 years, Xcel’s total customer base grew at an annual rate of 1 percent with an overall 10 percent increase or roughly 250,000 additional ratepayers. The graph below provides a breakdown by ratepayer type.
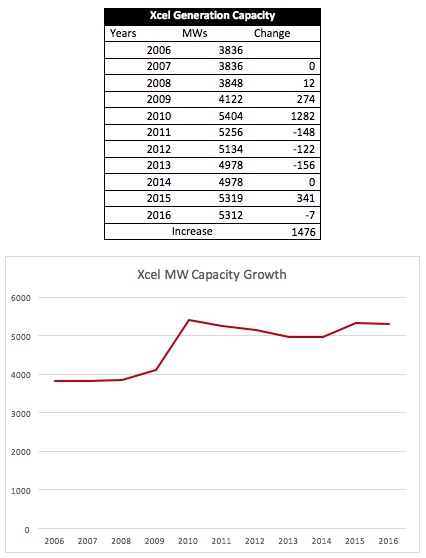
Generation
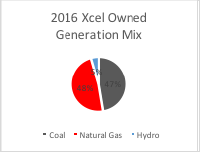
From 2006-2009, natural gas power plants accounted for approximately 26 percent of Xcel’s owned generation capacity. However, beginning in 2010, a noticeable shift began to occur. Steadily, coal generating capacity dropped and natural gas capacity rose—eventually surpassing coal in 2015 and 2016. Xcel’s coal capacity peaked in 2010 when it stopped selling coal-fired electricity to Black Hills. To comply with mandated fuel switching from coal to natural gas – the Clean Air Clean Jobs Act – Xcel shut down and reconfigured their Cherokee and Arapahoe coal units to natural gas units, reducing their coal capacity by 600 MW.

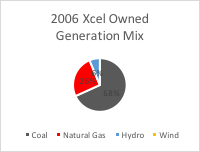
In 2006, Xcel’s coal generation (2617 MW) almost tripled their natural gas generation (977 MW). Ten years later, natural gas increased from one quarter to just below half of their owned capacity, while coal decreased 19 percent from 68 percent to 47 percent of Xcel’s owned generation mix.
Asset Values
Over the last decade, Xcel’s total asset values increased $6,442,465,00, 77 percent from $8,363,619,000 to $14,806,084,00.
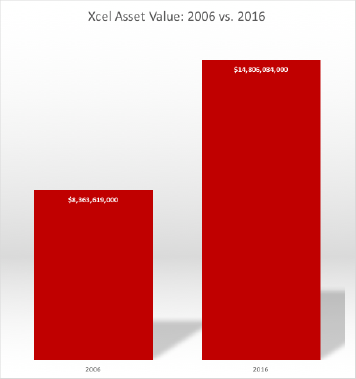
This growth occurred at an average annual rate of 7.7 percent, with six years where noticeable increases over $600,000,000 occurred. The dramatic increases took place between the years: 2009-2010 and 2011-2012, when the values increased by $1 billion.
| Year | Change |
| 2006-2007 | $615,811,000.00 |
| 2007-2008 | $815,539,000.00 |
| 2009-2010 | $1,011,082,000.00 |
| 2011-2012 | $1,270,664,000.00 |
| 2012-2013 | $961,465,000.00 |
| 2014-2015 | $716,869,000.00 |
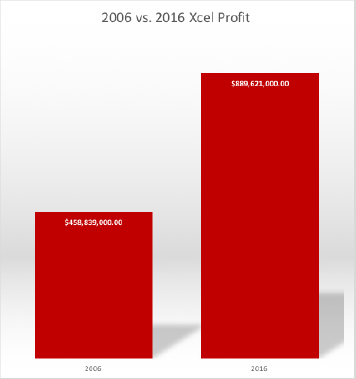
Revenue and Profits*
In the decade of the New Energy Economy, Xcel’s assets increased a whopping 77 percent, revenue increased only six percent, and operating expenses actually decreased six percent. Even with nearly flat revenue, Xcel’s profits have increased 93.89 percent and profit margins have increased from 12 percent in 2006 to nearly 22 percent in 2016.
* The profits presented in this report are both utilities’ operating income, and they were determined by subtracting yearly operating expenses from their yearly revenue.
What does this mean to ratepayers?
While Xcel’s revenue per ratepayer remained essentially flat, profit per ratepayer increased a staggering 76.7 percent from $178.09 in 2006 to $314.75 in 2016. How? Because the real money is in Xcel’s assets where the monopoly gets a roughly 10 percent rate of return. In 2006 assets per ratepayer were $3,246.24. By 2016 that number increased 61 percent to $5,238.47.
All of this happened with direction from state legislature and two Democrat governors and authorized by the PUC. In other words, ratepayers paid the price for Xcel to build new capacity that it didn’t need to meet customer demand. It built because elected officials said to build and the PUC authorized ratepayers to pay for it.
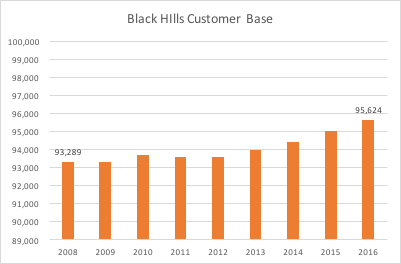
Black Hills Energy
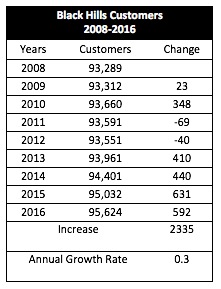
Like Xcel, Black Hills functions as a gas and electricity provider. For this report, the focus is on Black Hills’ electricity service. Since Black Hills began serving Pueblo in 2008, the company has had anemic electricity customer growth. In total, it has added 2,336 customers, which is a three percent increase from their 2008 levels. Seen below, the majority of their growth did not occur until after 2012.
Generation
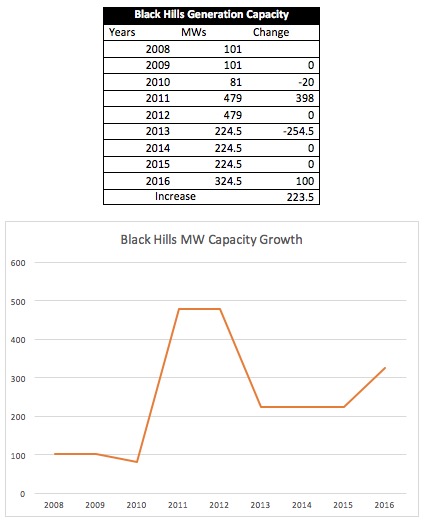
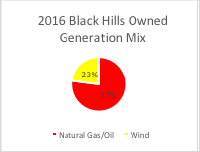
Black Hills is the case study for the New Energy Economy and Ritter’s original goal of completely moving away from coal toward natural gas and industrial wind. The monopoly eliminated its coal capacity when it took W.N. Clark offline in 2012 and built the Busch Wind Farm and the Peak View Wind Farm to comply with Colorado’s 30 percent renewable energy mandate.
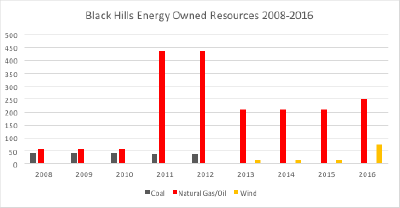
From 2008-2016, natural gas generation increased from 58 percent to 77 percent, and Black Hills added 74.5 MW of wind capacity (23 percent of their portfolio). Most importantly, the monopoly phased out coal entirely – a Ritter goal for both utilities under the NEE.

Asset Value
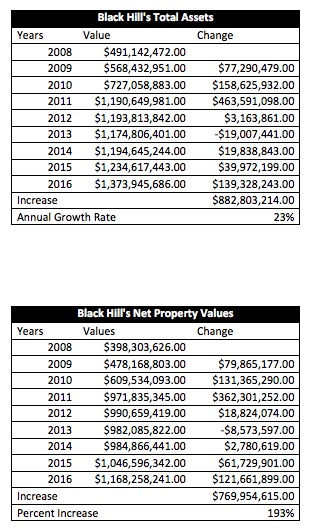
Since 2008, Black Hills’ total asset values increased $882,803,214 (180 percent) from $491,142,472 to $1,373,945,686, at an annual growth rate of 23 percent.

The table below documents the years when the amount changed the most.
| Years | Change |
| 2008-2009 | $77,290,479.00 |
| 2009-2010 | $158,625,932.00 |
| 2010-2011 | $463,591,098.00 |
| 2015-2016 | $139,328,243.00 |
In years where Black Hills’ total asset values rose new power plants came online. The increase in 2011 corresponds with when the Pueblo Airport Power Station began operating, and the increase from 2015-2016 occurred when their Peak View Wind Farm came online- both of which were in compliance with the New Energy Economy.
(See Appendix for more information about Xcel and Black Hill’s Assets)
Profits and Revenue
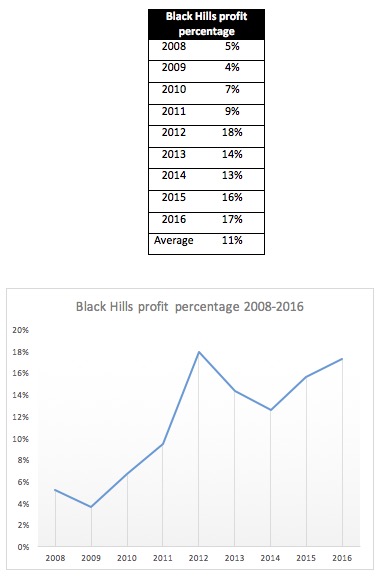
Black Hills increased their profit by 802 percent in the last eight years.
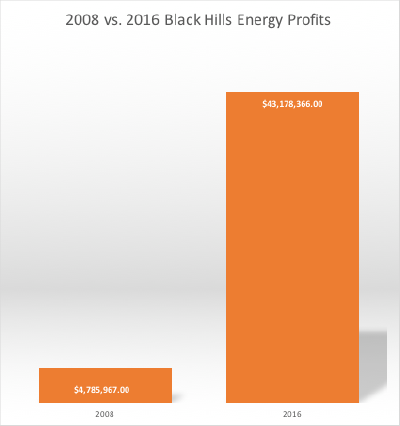
The New Energy Economy has proved expensive for Black Hills ratepayers. Its only coal generating station shut down, and natural gas/oil capacity increased from 26 percent to 48 percent. And due to Colorado’s renewable energy standard, the utility built the Bush Wind Farm (14.5 MW) and the Peak View Wind Farm (60 MW).
What does it mean for ratepayers?
Revenue per ratepayer has increased 165.55 percent from $984.68 in 2008 to $2614.78 in 2016. Assets per ratepayer have increased 173 percent from $5,264.74 in 2008 to $14,368.21 in 2016. And profits? They’ve increased an astounding 780 percent to $451.54 per ratepayer in 2016 from $51.30 in 2008.
This happened with direction from state legislature and two Democrat governors and authorized by the PUC. In other words, ratepayers paid the price for Black Hills to build new capacity to comply with the NEE. Black Hills built because elected officials wanted to change how the state generated electricity and the PUC authorized Black Hills ratepayers to pay for it.
Editors note: To be fair, the company was forced to build a new natural gas plant when Xcel decided not to sell some 300 megawatts of power to Black Hills because Xcel claimed it needed the additional capacity to meet ratepayers’ electric demands. Apparently, Xcel overestimated demand and then tried to recover the cost of NOT selling that power to Black Hills. Black Hills subsequently built a $487 million plant to supply power it once purchased from Xcel, the cost of which was passed along to Black Hills’ ratepayers.
Both Utilities Together
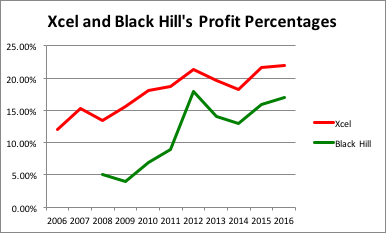
Both utilities’ annual profit margins (revenue minus expenses) increased. On average, Xcel’s 17.85 percent, but several times broke the 20 percent rate. Black Hills’ average was lower at 11 percent, but in 2015 and 2016, rose to 17 percent.
(See Appendix for more information about Xcel and Black Hill’s profits)
Since 2010, Xcel Energy and Black Hills Energy’s customer bases increased slightly, while their profits increased significantly. Xcel acquired 250,000 more customers (10 percent increase), but their profit margins grew by 94 percent. The same goes for Black Hills but on a larger split. Their customer base only grew 3 percent as profits increased 802 percent.

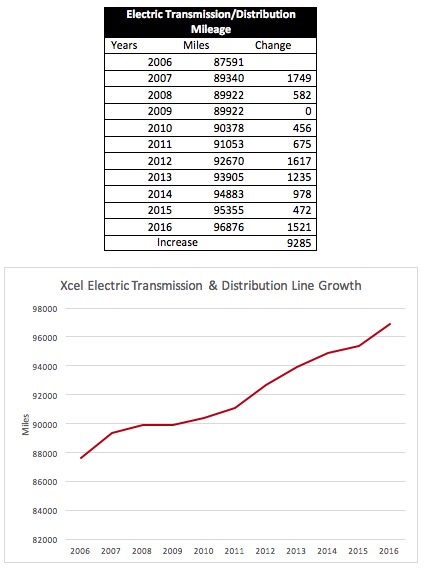
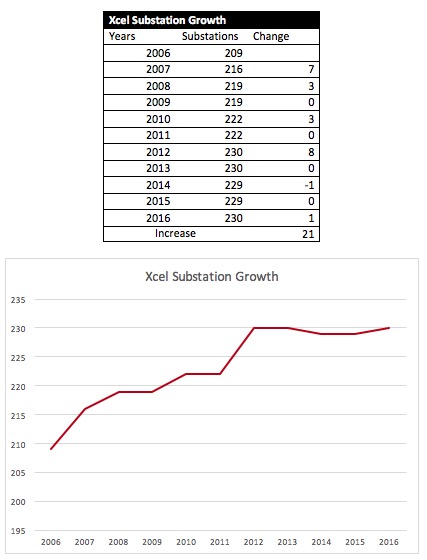
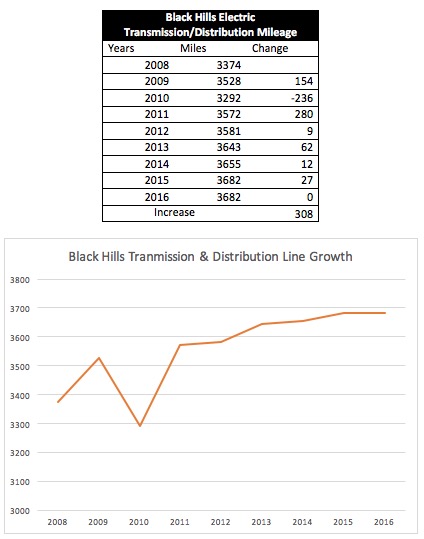
Obviously, rising profits are not due to an influx of customers but because of building projects and increased assets. Both monopolies acquired more megawatt capacity and transmission/distribution line mileage.
Conclusion
Regulated utilities understand that increasing profitability follows building and increasing the value of their asset base, or as Forbes contributor, Steve Pociask, stated: “The dirty little secret with many public utilities is that the more they invest, the more profits they make. That is true whether or not that investment is needed or in the public’s interest.”
Simply put, to procure higher margins, the utilities need to expand or increase assets’ values. Expansion and investment happen in order to meet higher energy demand, compliance with laws and regulations, or renewable energy standards. But as electricity sales remain flat or decrease, indicating a decrease in demand, former Governor Bill Ritter’s New Energy Economy most likely caused both utilities’ significant rise in asset values and profits. Whether it was the Clean Air Clean Jobs Act or the Renewable Energy Standard of 30 percent by 2020, both utilities were impacted.
To comply with CACJA, Xcel built three gas combustion turbines at their Cherokee Denver Power station; they installed emissions controls in 2014 at Pawnee Power Station and in 2016 at Hayden Power Station; and their coal capacity reduced from above 3000 to 2500 MWs.
The impact on Black Hills is even more apparent. Their only coal generating station shut down, and natural gas/oil capacity increased from 26 percent to 48 percent. And due to Colorado’s renewable energy standard, the utility built the Bush Wind Farm (14.5 MW) and the Peak View Wind Farm (60 MW).
Increased monopoly utility profits coincide with the New Energy Economy era. It transformed Colorado’s energy portfolio and increased both Xcel and Black Hill’s asset bases’ values. While the utilities benefited financially, it’s the state legislature that passed the legislation and the PUC that authorized higher rates and profits.
If consumers don’t like it, they should take it up with their lawmakers and the PUC.
Brit Naas is an intern with the Independence Institute’s Future Leaders Project in Energy and Environmental Policy, and is a student at Concordia University Irvine.
Amy Cooke and Michael Sandoval contributed to this report.
Editor’s note: This post was updated twice to reflect Black Hills’ natural gas service including its 2016 acquistion of SourceGas. According to Black Hills, it now serves “167,000 natural gas customers in 104 Colorado communities.”
Xcel’s portfolio information, asset values, and profit data can be found in The Public Service Company’s (Xcel subsidiary) financial reports.
2006: https://www.snl.com/Cache/c3472966.html
2007: https://www.snl.com/Cache/c5661937.html
2008: https://www.snl.com/Cache/c7425322.html
2009: https://www.snl.com/Cache/c9131791.html
2010: https://www.snl.com/Cache/c10809551.html
2011: https://www.snl.com/Cache/c12781725.html
2012: https://www.snl.com/Cache/c16128992.html
2013: https://www.snl.com/Cache/c22188521.html
2014: https://www.snl.com/Cache/c27839212.html
2015: https://www.snl.com/Cache/c33045532.html
2016: https://www.snl.com/Cache/c38223626.html
Black Hills Energy’s asset values and profit can be found in their FERC Form 1s.
2008: https://ir.blackhillscorp.com/Cache/7710589.PDF?Y=&O=PDF&D=&FID=7710589&T=&OSID=9&IID=4010420
2009: https://ir.blackhillscorp.com/Cache/9380714.PDF?Y=&O=PDF&D=&FID=9380714&T=&OSID=9&IID=4010420
2010: https://ir.blackhillscorp.com/Cache/11085649.PDF?Y=&O=PDF&D=&FID=11085649&T=&OSID=9&IID=4010420
2011: https://ir.blackhillscorp.com/Cache/13191117.PDF?Y=&O=PDF&D=&FID=13191117&T=&OSID=9&IID=4010420
2012: https://ir.blackhillscorp.com/Cache/16758495.PDF?Y=&O=PDF&D=&FID=16758495&T=&OSID=9&IID=4010420
2013: https://ir.blackhillscorp.com/Cache/23260079.PDF?Y=&O=PDF&D=&FID=23260079&T=&OSID=9&IID=4010420
2014: https://ir.blackhillscorp.com/Cache/29161155.PDF?Y=&O=PDF&D=&FID=29161155&T=&OSID=9&IID=4010420
2015: https://ir.blackhillscorp.com/Cache/33954350.PDF?Y=&O=PDF&D=&FID=33954350&T=&OSID=9&IID=4010420
2016: https://ir.blackhillscorp.com/Cache/2000817905.PDF?Y=&O=PDF&D=&FID=2000817905&T=&OSID=9&IID=4010420
Black Hills Energy generation information can be found in company’s financial filings.
2008: https://ir.blackhillscorp.com/Cache/c7424669.html
2009: https://ir.blackhillscorp.com/Cache/c9093046.html
2010: https://ir.blackhillscorp.com/Cache/c10802200.html
2011: https://ir.blackhillscorp.com/Cache/c12816239.html
2012: https://ir.blackhillscorp.com/Cache/c16128242.html
2013: https://ir.blackhillscorp.com/Cache/c22233149.html
2014: https://ir.blackhillscorp.com/Cache/c30610705.html
2015: https://ir.blackhillscorp.com/Cache/c33091405.html
2016: https://ir.blackhillscorp.com/Cache/c38242444.html
Appendix